emf.EMFAnalysis2D.plot_geometry
-
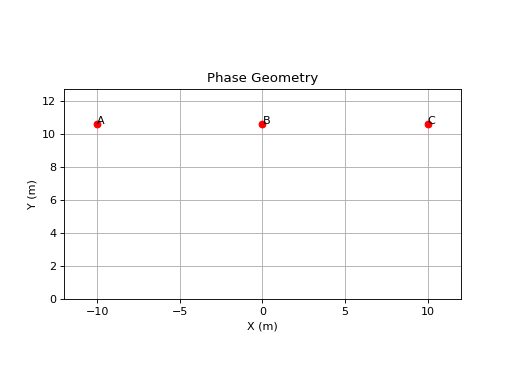
EMFAnalysis2D.plot_geometry(self)[source]¶ Plots the geometry of the analysis.
Examples
# geometry.py
import numpy as np
from emf import Phase2D, EMFAnalysis2D

phases = [
    Phase2D('A', -10, 10.6, 0.033, 525000, 1000, 120, 3, 0.45),
    Phase2D('B', 0, 10.6, 0.033, 525000, 1000, 0, 3, 0.45),
    Phase2D('C', 10, 10.6, 0.033, 525000, 1000, -120, 3, 0.45),
]

emf = EMFAnalysis2D(phases)
emf.plot_geometry()
(Source code, png, hires.png, pdf)